Technical Info about Portfolio Slicer
Overview
Portfolio Slicer is built entirely on Microsoft technologies. There are no third-party add-ins required for the core model.
Portfolio Slicer loads files prepared for Portfolio Slicer reports into an Excel Power Pivot or Power BI data model and then uses that model, together with predefined DAX measures, to calculate your investment values at any point in time.
Technical info Video
Open Model Philosophy
Portfolio Slicer is not a black-box system.
The workbook structure, data model, and calculations are open for inspection. Advanced users who understand Power Pivot and DAX can review how the model works and extend it to suit their own needs.
What Happens During Refresh
When you refresh Portfolio Slicer, the following happens:
- Excel or Power BI loads the existing Power Pivot model from disk into memory (usually 2-3 seconds)
- the Power Pivot model reads the files prepared for Portfolio Slicer reports
- while loading these tables, the model may also add calculated columns
For example, although the Dates table has just one column in the Dates.csv file, all other columns such asYear,Quarter, and similar values are added in the model as calculated columns - as soon as the model is updated, that triggers Excel or Power BI report refresh Excel refresh updates all reports in all worksheets Power BI refreshes only the page you are currently viewing, and then refreshes other pages when you visit them
Here is how the Portfolio Slicer model looks in Power Pivot.
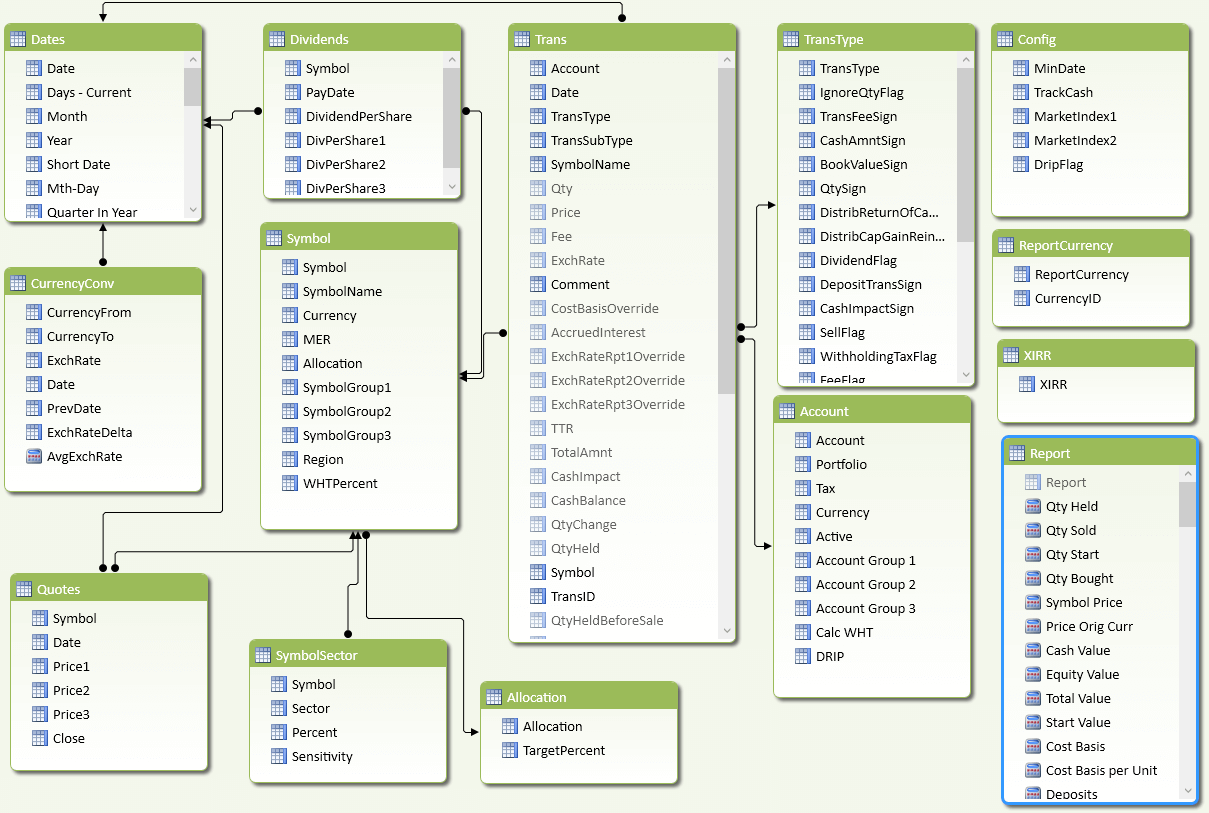
Why the Data Model Matters
The Power Pivot model is the engine behind Portfolio Slicer reports.
When any report needs to show a value such as total portfolio value, the model can combine:
- holdings quantity
- latest available quote for the selected period
- currency conversion rates
- cash impact from transactions
This is why Portfolio Slicer can support historical and multi-currency reporting in ways that are difficult to achieve with a simple spreadsheet alone.
Simplified Example
When Portfolio Slicer calculates a value such as total portfolio value, the model may need to:
- determine quantities held for each symbol at the selected date. To do that, the engine queries the Transactions table from the start up to the selected date and adds or subtracts quantity based on transaction type.
- Find the relevant quote for each symbol. If a quote for the exact date is not found, the engine looks for the last available quote.
- Determine the required currency conversion. If a conversion record for the exact date is not found, the engine looks for the last available exchange rate.
- calculate equity value.
- calculate cash value.
- combine those pieces into the final reported value.
The exact calculations can become complex, especially once multiple accounts, currencies, and transaction types are involved.
Why Advanced Users Care
If you are comfortable with Excel data models, DAX, or report design, Portfolio Slicer gives you a base that you can inspect and extend.
This is especially useful if you want to:
- understand how calculations are produced
- create your own measures or report layouts
- troubleshoot unusual model behavior
- build specialized investment reports on top of the same source data