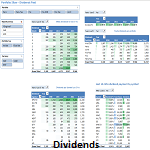
Portfolio Slicer
Free Excel workbook (template) for investment tracking
2023-02-12 news: Portfolio Slicer v3.1.0 is now available.
Portfolio Slicer is a FREE for personal use Excel workbook/template that lets you track your Stock, ETFs and Mutual Fund investments your way.
 If you are comfortable with Excel, then you will love Portfolio Slicer. You will tell Portfolio Slicer about your investments by entering data into pre-defined Excel tables. You will see how your investments are doing in over 40+ pre-built Excel financial reports and if you know Excel Pivot Tables and Pivot Charts, you can add as many more reports as you need.
Portfolio Slicer was built using Microsoft Power Pivot technology that is fully integrated into Excel. Portfolio Slicer takes data that you provided and loads all this into PowerPivot data model that has close to 150 defined calculations. Then all Excel reports are built from this very powerful data model that can easily calculate how your investments were doing at any point in time.
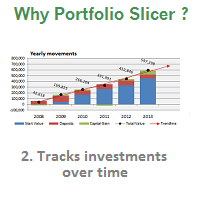 Majority of Portfolio trackers can tell you how much your investments are worth NOW. Portfolio Slicer can tell your investment values AT ANY POINT IN TIME. With Portfolio Slicer you can see investment capital gains/loss over last 30 days, last 12 months or last 5 years. With Portfolio Slicer you can track how much dividends/interest you received over any selected period. With Portfolio Slicer there are no limits - if you will enter last 20 years of your investment transactions and create quotes and currency exchange rate files for 20 years, than you can have full picture of your investments for over last 20 years!
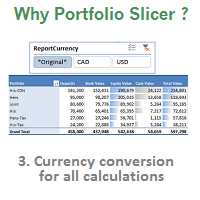 Portfolio Slicer lets you track your investments in up to 3 different reporting currencies. Every calculation defined in Portfolio Slicer was built with currency conversion in mind. If you have investments in different currencies, then you will love Portfolio Slicer. With Portfolio Slicer you will be able to see not just what is your capital gain or loss today(this month/year), but also how much this value was impacted by currency exchange rate change.
Other Portfolio Slicer features
- Portfolio Slicer keeps all your investment transactions in one place. If you ever need to find any transaction for any reason, you will be able to do that in Excel in seconds.
- Portfolio Slicer helps you track Cost Basis, also called Adjusted Cost Base (ACB) and it can do that in up to 3 different currencies.
- Portfolio Slicer tracks not just your investments but also cash!
- Portfolio Slicer lets you add information about dividends received either manually (based on your investment institution statements) or calculate them for you based on dividend file.
- Portfolio Slicer lets you see your investments performance in comparison to the Market Indexes.
- Again, Portfolio Slicer is FREE for personal use!
Portfolio Slicer is usually used in one of the following setups:
- Complete investment and cash tracking. If you choose to use Portfolio Slicer for complete investment and cash tracking, you will have to enter every single transaction from your investment broker/bank statement – deposits, buy, sell, dividend payments, etc. This is time consuming, but will give you complete picture of all your investments and cash that is ready for investments.
- Investment tracking without cash and approximate dividends. This would be the fastest way to start using Portfolio Slicer – user would have to enter just buy/sell/split transactions and distribution transactions that affects cost basis. This information is minimum that investors must track so they can later calculate capital gains or losses for taxes. Reports generated by Portfolio Slicer would give you equity investment values (no cash) over time and approximate dividend payment information.
- Hypothetical portfolio analysis. Some users use Portfolio Slicer to test their investment strategies. In such cases they record buy transactions and analyze how their hypothetical investment would have performed overtime comparing to broad indexes or other hypothetical portfolios.
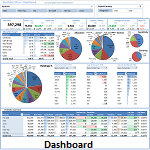
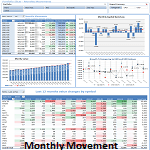
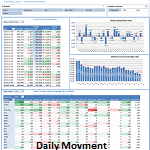
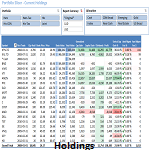
Report Screen Shoots
Next steps
- Follow step by step guide on how to start using Portfolio Slicer with your own data.
User Reviews
- Portfolio Slicer is an amazing tool to track your investments and build your own portfolios using excel. The flexibility and the ability to create unlimited own reports for your portfolios makes Portfolio Slicer to the best portfolio tracker I have had!!!. I definitely recommend Portfolio Slicer!! - Jonathan Schön
- Once you get to grips with Powerpivot, this is a really simple (but very powerful) spread sheet and is far better than anything I’ve ever seen on the web. Customizing the data sets, sectors, tables, graphs etc is simple with a bit of Excel knowledge and I’ve even written my own metrics after a 15mins crash course on the Microsoft DAX set of instructions (pretty straightforward if you can code in VBA or SQL). A brilliant piece of kit and highly recommended to any enthusiastic investor. - Jimbo
- This is an awesome tool and will help me a great deal in tracking my investments. I was doing some of these in Excel myself but it’s no where close to what I can get with PS tool. -GOO
- I’m still using it regularly and it’s pretty much everything I wanted Quicken to be. -m3s
- The tool takes some time to set up, but offers comprehensive analysis. - R.P. - The Motley Fool
