Portfolio Slicer report files
Overview
Portfolio Slicer comes with 3 report files:
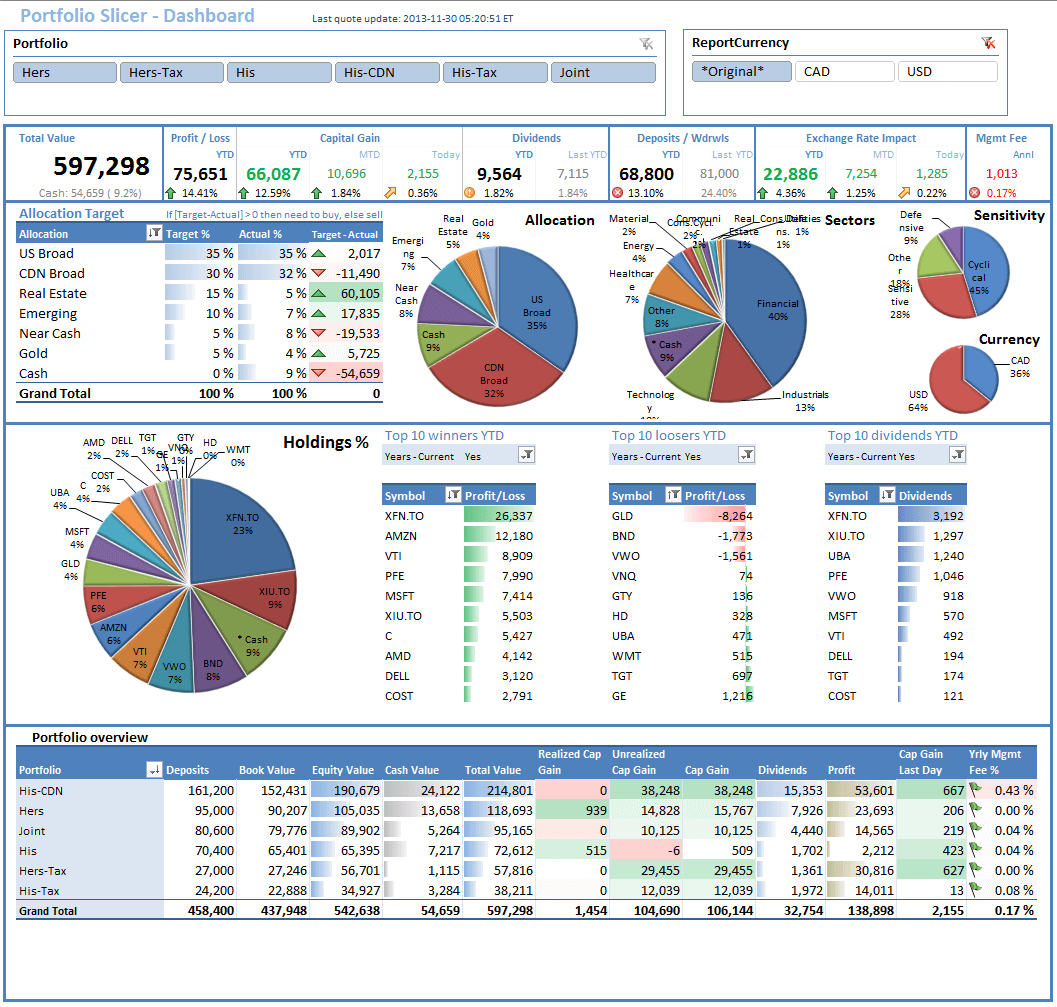
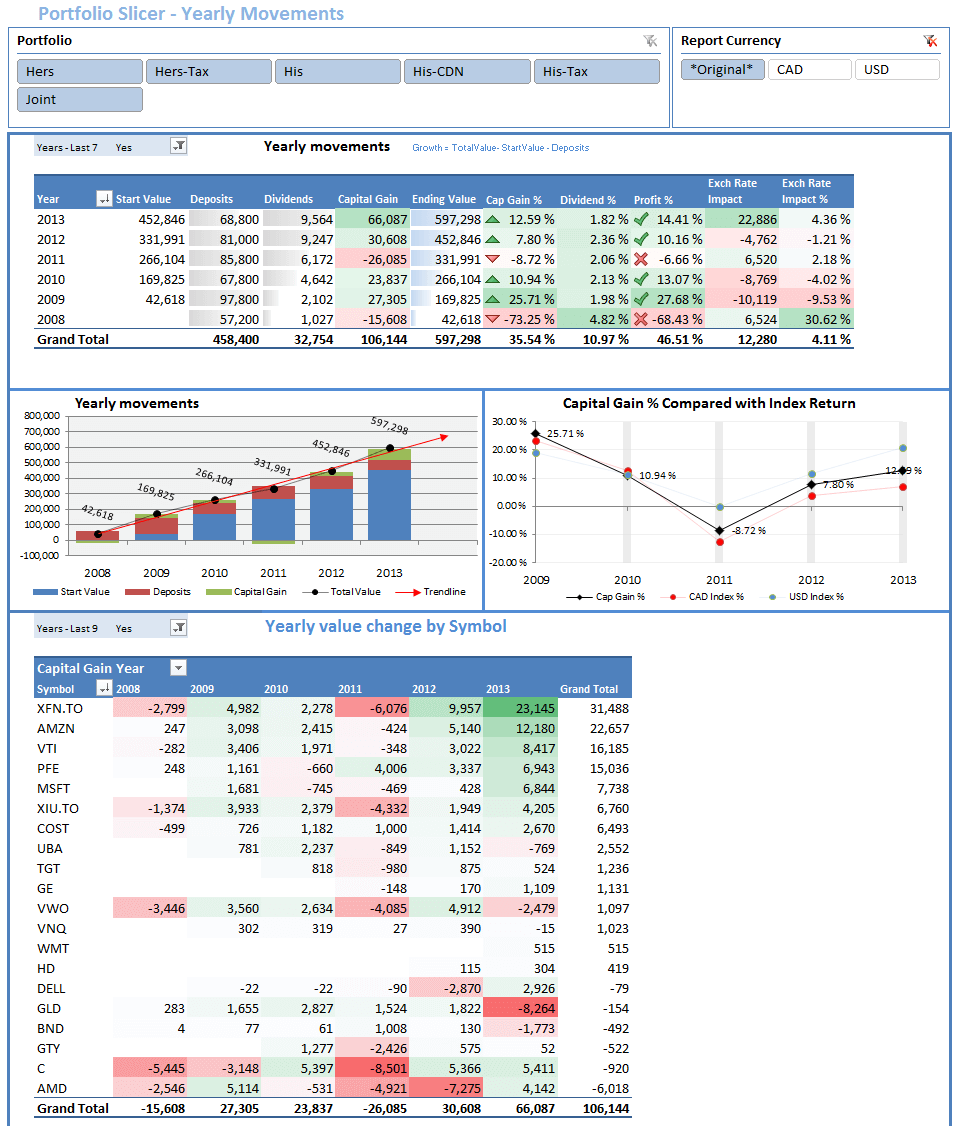
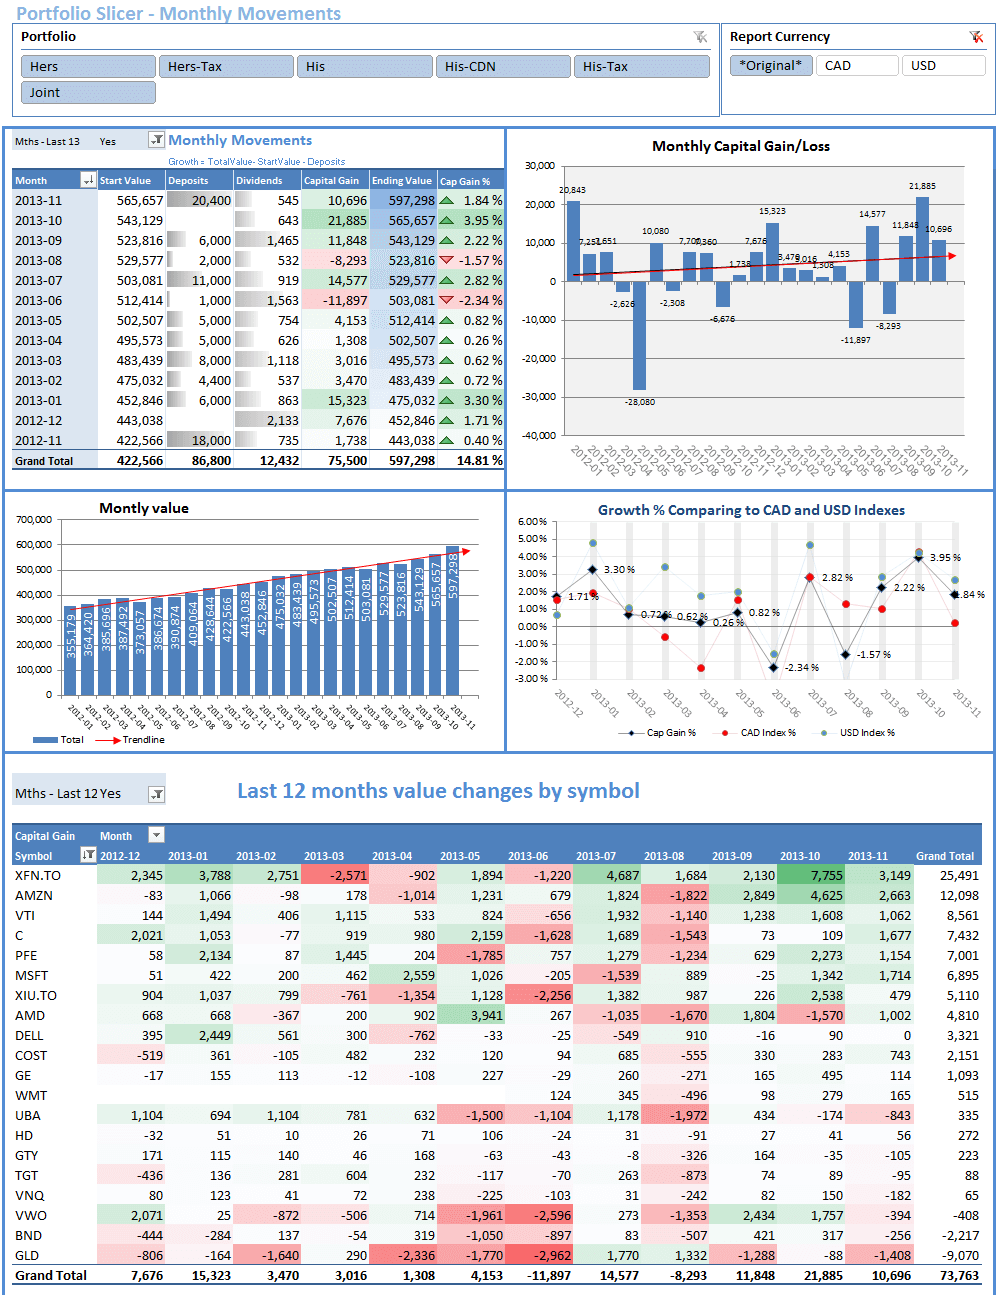
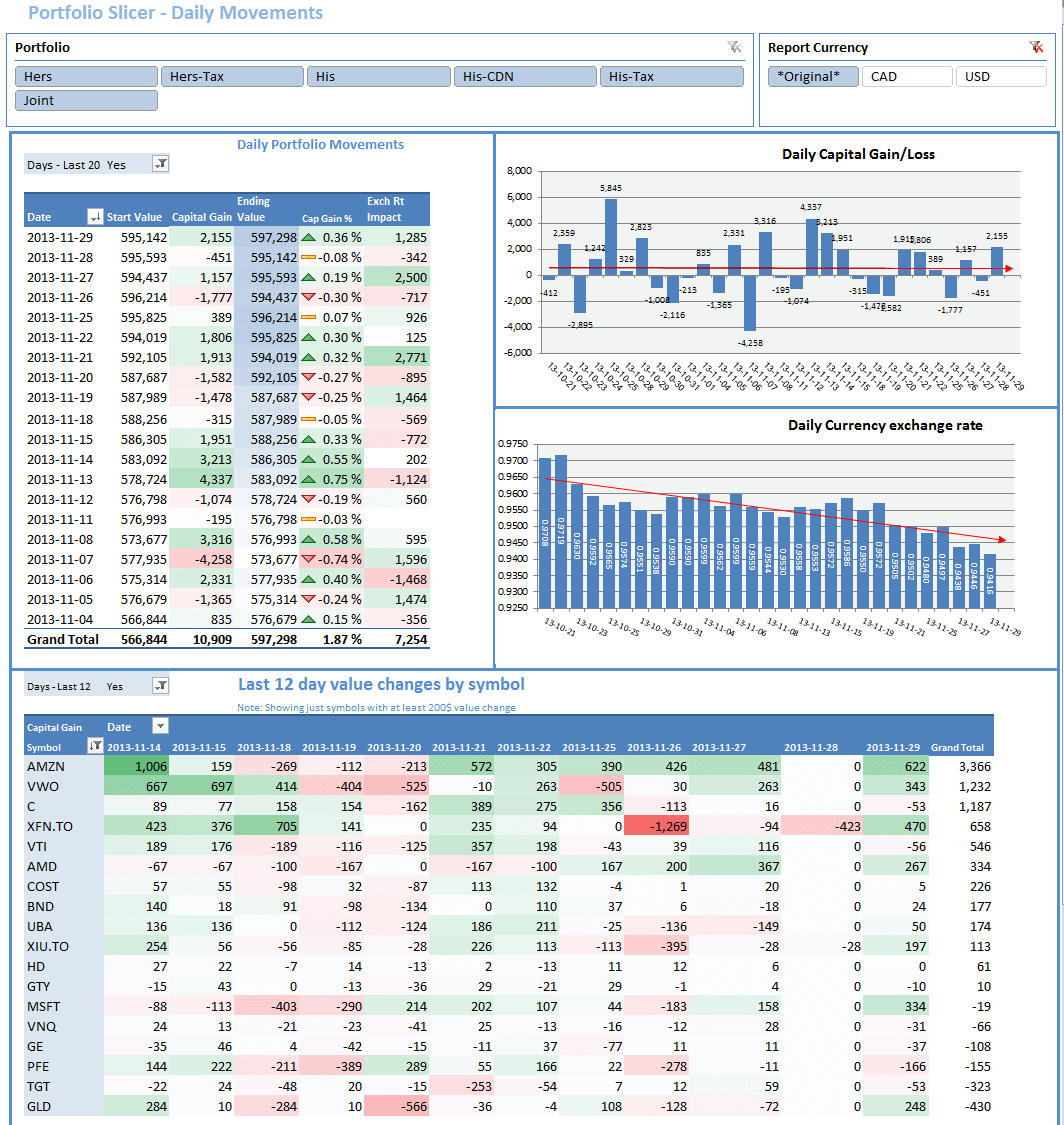
PortfolioSlicer-Reports.xlsx- the full Portfolio Slicer model with 30+ pre-built reports. For average-size portfolios, it may take up to 2 minutes to refresh this report file, or even longer.PortfolioSlicer-Reports-Light.xlsx- a lighter version of the Excel reports file with a simplified model and fewer reports. Because this workbook contains fewer and simpler reports, refresh time is usually much faster, often 2-3 times faster than the full reports file.PortfolioSlicer.pbix- the Power BI version of Portfolio Slicer, with almost the same model and calculations as the Excel reports file. The reports in Power BI are slightly different, but at the core they provide the same information.
Important note: Actual file names include a version number, for example PortfolioSlicer3.1-Reports.xlsx, but this documentation does not include version numbers in file names.
The key difference between Excel reports and Power BI reports is that Power BI reports usually feel much faster during refresh.
This is because when you refresh data in the Excel model, all reports (30+) in all worksheets are recalculated at once before you can interact with them.
When you refresh data in the Power BI model, only the reports on the current page are recalculated. Reports on other pages are recalculated only when you visit them.
How to use Portfolio Slicer reports
When you open Portfolio Slicer reports, you will see the last saved values. If you added more transactions to the source file, or if investment quotes or exchange rates have changed, you need to follow these steps to update your Portfolio Slicer reports:
- Run the scripts to update files used for Portfolio Slicer reports.
- Open the reports file and refresh the Excel or Power BI model. Please note that refreshing the Power Pivot model automatically triggers report recalculation.
After these 2 steps you are ready to review the reports or interact with them using slicers and filters. You can also consider building your own custom reports, but that requires a good understanding of Excel and PivotTables.
Choosing which report file to use
If you prefer to see your reports in Excel, you will use either PortfolioSlicer-Reports.xlsx or PortfolioSlicer-Reports-Light.xlsx.
For a quick look at your portfolio changes, the Light report version is usually enough, because it refreshes much faster.
For more in-depth portfolio analysis, use the full report file.
If you are comfortable working in the Power BI environment, then consider using Portfolio Slicer Power BI reports.
Portfolio Slicer model
If you are interested in learning a bit more about the Portfolio Slicer model, review the following pages:
- Technical information
- DAX measures
- How model calculates capital gain, dividend percent, and profit percent
Excel Guidance
These pages apply to Excel reports:
- Refreshing Portfolio Slicer Excel data
- Changing Portfolio Slicer Excel workbook external data location
- Refresh issues and guidance
- Customize reports
Power BI
These pages document the Power BI version of Portfolio Slicer and related publishing workflows:
- What is Portfolio Slicer for Power BI
- How to refresh Portfolio Slicer in Power BI Desktop
- How to change Power BI connections
- How to publish to Power BI service
- How to schedule refresh on Power BI service
- How to create dashboard in Power BI
- Portfolio Slicer Power BI Demo
Portfolio Slicer reports in Excel